


Quay lại với chủ để XGBoost, hôm nay chúng ta sẽ tìm hiểu cách thức lự chọn features cho XGBoost model.
Feature selection hay lựa chọn features là một bước tương đối quan trọng trước khi train XGBoost model. Lựa chọn đúng các features sẽ giúp model khái quát hóa vấn đề tốt hơn (low variance) -> đạt độ chính xác cao hơn.
Trong bài viết này, hãy cùng xem xét về cách dùng thư viện XGBoost để tính importance scores và thể hiện nó trên đồ thị, sau đó lựa chọn các features để train XGBoost model dựa trên importance scores đó.
1. Tính và hiển thị importance score trên đồ thị
1.1 Cách 1
Model XGBoost đã train sẽ tự động tính toán mức độ quan trọng của các features. Các giá trị này được lưu trong biến feature_importances_ của model đã train. Kiểm tra bằng cách:
print(model.feature_importances_)Thể hiện các features importance lên đồ thị:
# plot
pyplot.bar(range(len(model.feature_importances_)), model.feature_importances_)
pyplot.show()
Code dưới đây minh họa đầy đủ việc train XGBoost model trên tập dữ liệu Pima Indians onset of diabetes và hiển thị các features importances lên đồ thị:
# plot feature importance manually
from numpy import loadtxt
from XGBoost import XGBClassifier
from matplotlib import pyplot
# load data
dataset = loadtxt('pima-indians-diabetes.csv', delimiter=",")
# split data into X and y
X = dataset[:,0:8]
y = dataset[:,8]
# fit model on training data
model = XGBClassifier()
model.fit(X, y)
# feature importance
print(model.feature_importances_)
# plot
pyplot.bar(range(len(model.feature_importances_)), model.feature_importances_)
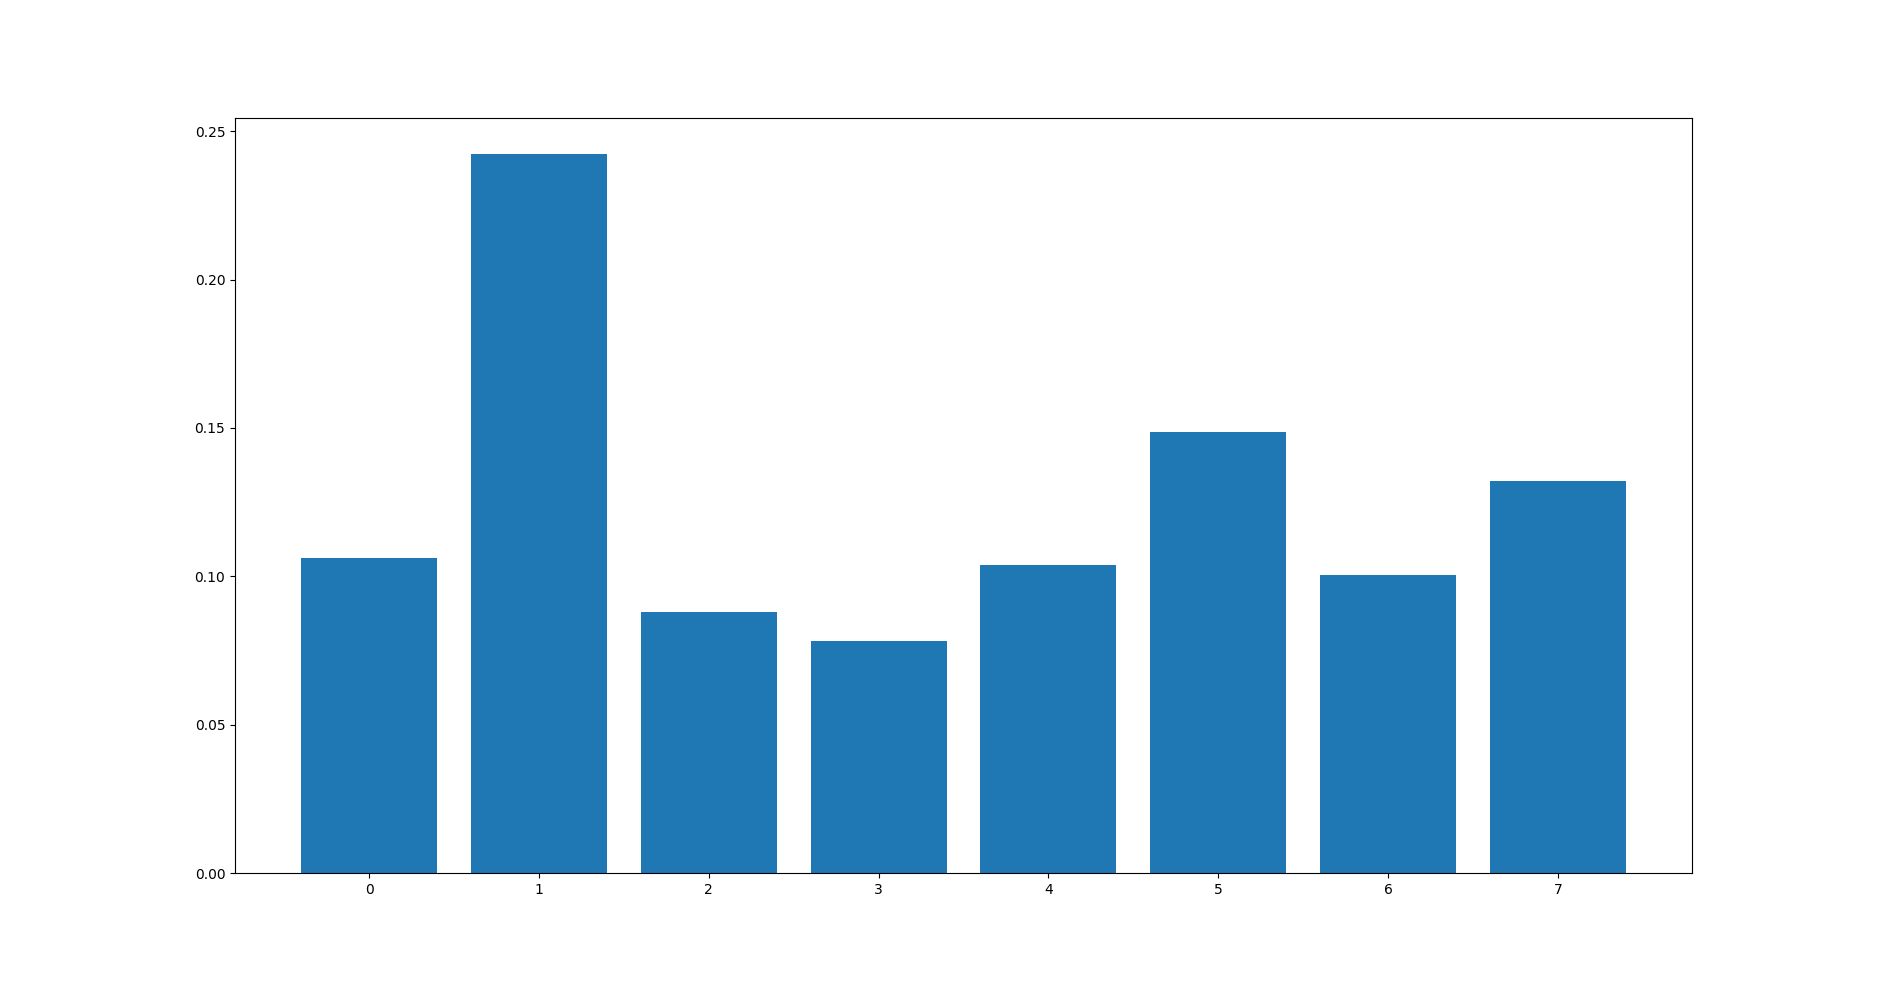
pyplot.show()Chạy code trên, importance score được in ra:
[0.10621197 0.2424023  0.08803366 0.07818192 0.10381887 0.1486732
 0.10059207 0.13208601]
và đồ thị:
1.2 Cách 2
Nhược điểm của cách này là các importance scores được sắp xếp theo thứ tự của các features trong tập dataset. Điều này làm cho chúng ta khó quan sát trong trường hợp số lượng features lớn. Liệu có thể sắp thứ tự các importance scores này theo giá trị của chúng được hay không? Câu trả lời là có thể. Thư viện XGBoost có một hàm gọi là plot_importance() giúp chúng ta thực hiện việc này.
 # plot feature importance
plot_importance(model)
pyplot.show()
Code dưới đây minh họa đầy đủ việc train XGBoost model trên tập dữ liệu Pima Indians onset of diabetes và hiển thị các features importances lên đồ thị:
# plot feature importance using built-in function
from numpy import loadtxt
from XGBoost import XGBClassifier
from XGBoost import plot_importance
from matplotlib import pyplot
# load data
dataset = loadtxt('pima-indians-diabetes.csv', delimiter=",")
# split data into X and y
X = dataset[:,0:8]
y = dataset[:,8]
# fit model on training data
model = XGBClassifier()
model.fit(X, y)
# plot feature importance
plot_importance(model)
pyplot.show()
Chạy code ví dụ bên trên thu được kết quả:
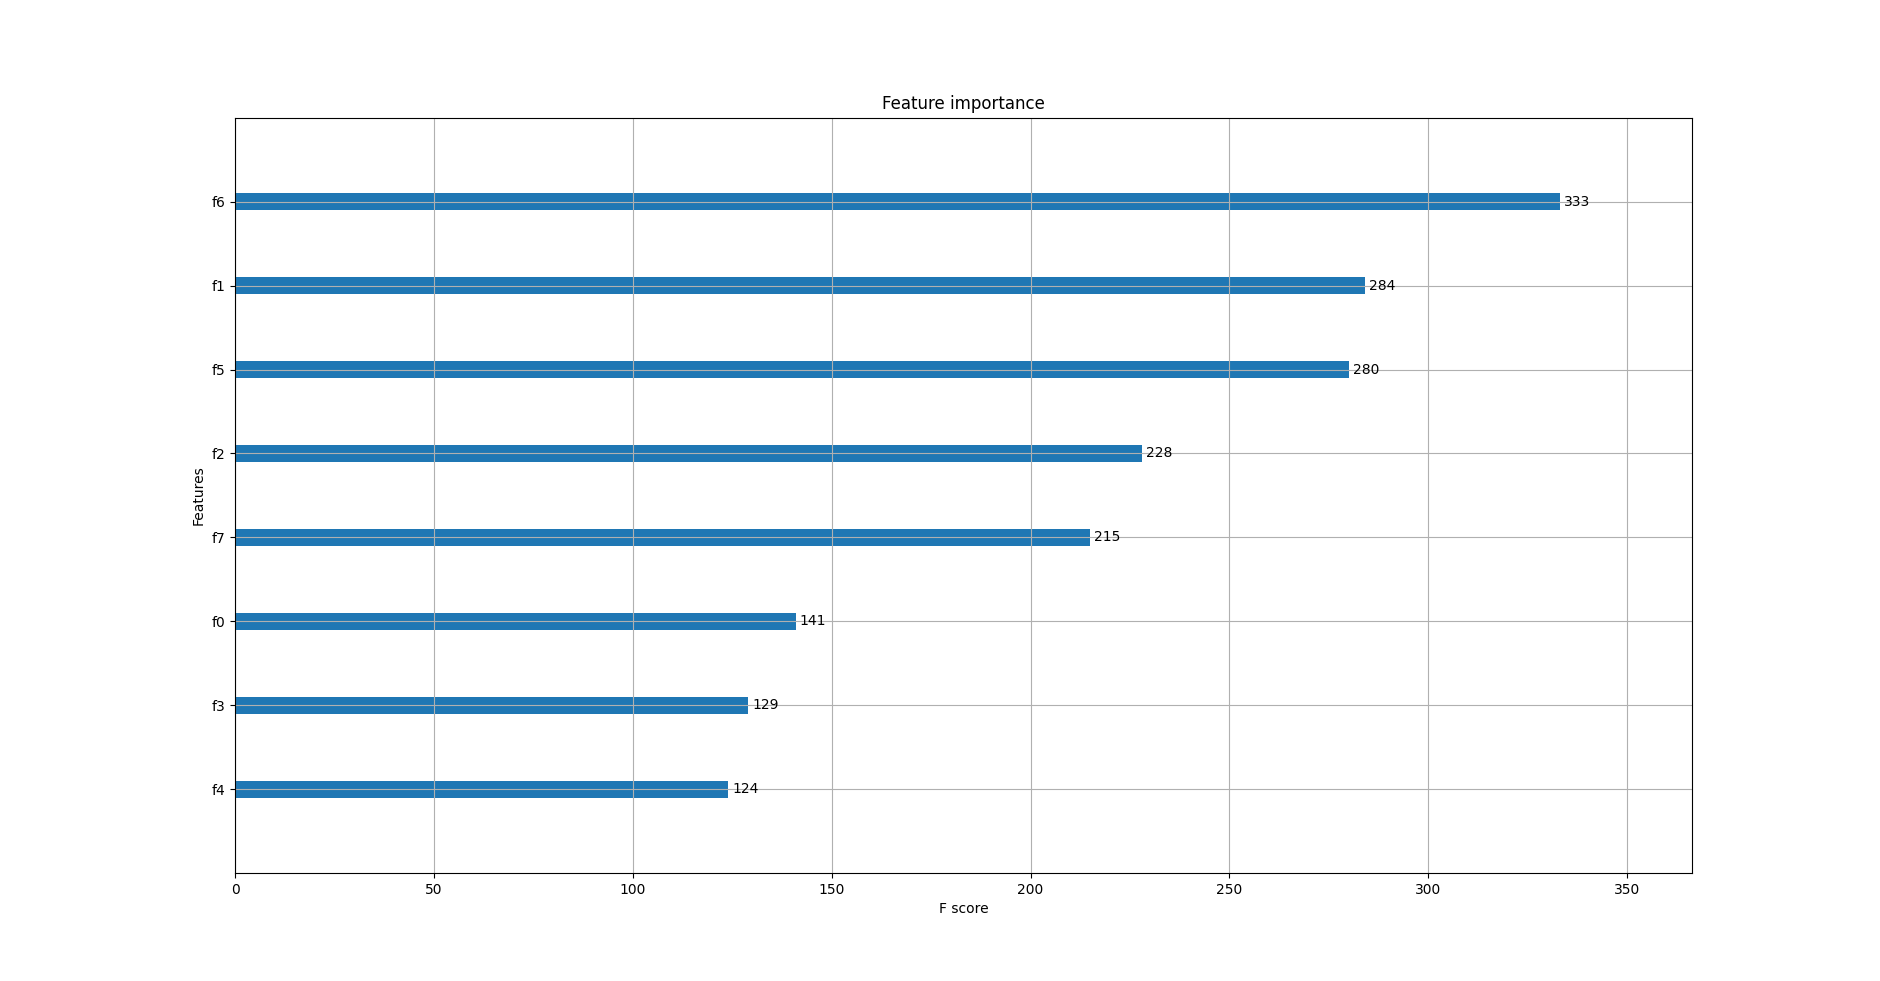
Quan sát đồ thị ta thấy, các features được tự động đặt tên từ f0 đến f7 theo thứ tự của chúng trong mảng dữ liệu input X. Từ đồ thị có thể kết lụân rằng:
- f6 có
importance scorecao nhất – 333 - f4 có
importance scorethấp nhất – 124
Nếu có bảng mô tả dữ liệu, ta có thể ánh xạ f4, f6 thành tên các features tương ứng.
2. Lựa chọn features (feature selection) theo importance scores
Thư viện scikit-learn cung cấp lớp SelectFromModel cho phép lựa chọn các features để train model. Lớp này yêu cầu 2 tham số bắt buộc:
- model: model đã được train trên toàn bộ dataset.
- threshold: ngưỡng để lựa chọn
features. Chỉ nhữngfeaturescóimportance scorekhông nhỏ hơn ngưỡng mới được lựa chọn.
Sau khi gọi hàmtransform()thì lớpSelectFromModelsẽ chuyển đổi tập dữ liệu ban đầu thành tập dữ liệu nhỏ hơn chỉ bao gồm cácfeaturesđược chọn.# select features using threshold selection = SelectFromModel(model, threshold=thresh, prefit=True) select_X_train = selection.transform(X_train)Sau khi có tập dữ liệu mới, ta tiến hành train và đánh giá model mới tạo ra như bình thường.
# train model selection_model = XGBClassifier() selection_model.fit(select_X_train, y_train) # eval model select_X_test = selection.transform(X_test) y_pred = selection_model.predict(select_X_test)Trong các bài toán thực tế, ta thường không biết chính xác giá trị nào của
thresholdlà phù hợp. Vì vậy mà ta sẽtuninggiá trị này bằng phương phápgrid-seach(mình sẽ có 1 bài viết riêng giải thích chi tiết về các phương pháp tuning hyper-parameters. Ở đây, bạn chỉ cần hiểu một cách đơn giản là kiểm tra với nhiều giá trị củathresholdđể chọn ra giá trị tốt nhất). Chúng ta sẽ bắt đầu kiểm tra với tất cảfeatures, kết thúc vớifeaturequan trọng nhất.
Code hoàn chỉnh như bên dưới:
# use feature importance for feature selection
from numpy import loadtxt
from numpy import sort
from XGBoost import XGBClassifier
from sklearn.model_selection import train_test_split
from sklearn.metrics import accuracy_score
from sklearn.feature_selection import SelectFromModel
# load data
dataset = loadtxt('pima-indians-diabetes.csv', delimiter=",")
# split data into X and y
X = dataset[:,0:8]
Y = dataset[:,8]
# split data into train and test sets
X_train, X_test, y_train, y_test = train_test_split(X, Y, test_size=0.33, random_state=7)
# fit model on all training data
model = XGBClassifier()
model.fit(X_train, y_train)
# make predictions for test data and evaluate
predictions = model.predict(X_test)
accuracy = accuracy_score(y_test, predictions)
print("Accuracy: %.2f%%" % (accuracy * 100.0))
# Fit model using each importance as a threshold
thresholds = sort(model.feature_importances_)
for thresh in thresholds:
# select features using threshold
selection = SelectFromModel(model, threshold=thresh, prefit=True)
select_X_train = selection.transform(X_train)
# train model
selection_model = XGBClassifier()
selection_model.fit(select_X_train, y_train)
# eval model
select_X_test = selection.transform(X_test)
predictions = selection_model.predict(select_X_test)
accuracy = accuracy_score(y_test, predictions)
print("Thresh=%.3f, n=%d, Accuracy: %.2f%%" % (thresh, select_X_train.shape[1], accuracy*100.0))Chạy code trên thu được kết quả như sau:
Accuracy: 74.02%
Thresh=0.088, n=8, Accuracy: 74.02%
Thresh=0.089, n=7, Accuracy: 71.65%
Thresh=0.098, n=6, Accuracy: 71.26%
Thresh=0.098, n=5, Accuracy: 74.41%
Thresh=0.100, n=4, Accuracy: 74.80%
Thresh=0.136, n=3, Accuracy: 71.26%
Thresh=0.152, n=2, Accuracy: 71.26%
Thresh=0.240, n=1, Accuracy: 67.32%
Có thể thấy rằng độ chính xác của model cao nhất trên tập dữ liệu gồm 4 features quan trọng nhất và thấp nhất trên tập dữ liệu chỉ gồm một feature.
Tuning theo kiểu grid-seach như này đặc biệt hiệu quả trong trường hợp bộ dữ liệu lớn.
3. Kết luận
Trong bài viết này, chúng ta đã tìm hiểu cách thể hiện importance score của các features trên đồ thị và sử dụng importance score để lựa chọn các features sao cho model đạt được độ chính xác cao nhất.
Bài viết tiếp theo ta sẽ tìm hiểu cách giám sát (monitor) hiệu năng của model trong quá trình train và cấu hình early stop (dừng train khi model đáp ứng một tiêu chí nào đó). Hai kỹ thuật này rất cần thiết để train một XGBoost model tốt. Hãy cùng đón đọc! 🙂
Toàn bộ source code của bài này các bạn có thể tham khảo trên github cá nhân của mình tại github.
Xem bài viết gốc tại đây.


Vui lòng đăng nhập để bình luận.