


Chào mọi người! Mình là SuNT, đến từ team AI – VTI VN!
Đây là bài viết cuối cùng trong chuỗi bài về thuật toán XGBoost (danh sách toàn bộ bài viết trong chuỗi, các bạn có thể xem tại đây).
Trong quá trình training, XGBoost thường xuyên phải thực hiện công việc chọn lựa ngẫu nhiên tập dữ liệu con (subsamples) từ tập dữ liệu gốc ban đầu. Các kỹ thuật để làm việc này được gọi bằng cái tên Stochastic Gradient Boosting (SGB).
Trong bài này chúng ta sẽ cùng tìm hiểu về SGB và tuning SGB để tìm ra kỹ thuật phù hợp với bài toán.
1. Tuning Row Subsampling
Row subsampling liên quan đến việc chọn ngẫu nhiên các samples từ tập train set. Trong XGBoost, giá trị của row subsampling được chỉ ra bởi tham số subsample. Giá trị mặc định là 1, nghĩa là sử dụng toàn bộ tập train set, không subsampling.
Tiếp tục sử dụng tập Otto dataset, chúng ta sẽ grid-search tham số subsample với các giá trị như sau: [0.1, 0.2, 0.3, 0.4, 0.5, 0.6, 0.7, 0.8, 1.0].
Có 9 giá trị của subsample, mỗi model sẽ được đánh giá sử dụng 10-fold cross-validation. Như vậy, có 9×10=90 models cần phải trained.
Code đầy đủ như sau:
# XGBoost on Otto dataset, tune subsample
from pandas import read_csv
from xgboost import XGBClassifier
from sklearn.model_selection import GridSearchCV
from sklearn.model_selection import StratifiedKFold
from sklearn.preprocessing import LabelEncoder
import matplotlib
matplotlib.use('Agg')
from matplotlib import pyplot

# load data
data = read_csv('train.csv')
dataset = data.values

# split data into X and y
X = dataset[:,0:94]
y = dataset[:,94]

# encode string class values as integers
label_encoded_y = LabelEncoder().fit_transform(y)

# grid search
model = XGBClassifier()
subsample = [0.1, 0.2, 0.3, 0.4, 0.5, 0.6, 0.7, 0.8, 1.0]
param_grid = dict(subsample=subsample)
kfold = StratifiedKFold(n_splits=10, shuffle=True, random_state=7)
grid_search = GridSearchCV(model, param_grid, scoring="accuracy", n_jobs=-1, cv=kfold, verbose=1)
grid_result = grid_search.fit(X, label_encoded_y)

# summarize results
print("Best: %f using %s" % (grid_result.best_score_, grid_result.best_params_))
means = grid_result.cv_results_['mean_test_score']
stds = grid_result.cv_results_['std_test_score']
params = grid_result.cv_results_['params']
for mean, stdev, param in zip(means, stds, params):
    print("%f (%f) with: %r" % (mean, stdev, param))

# plot
pyplot.errorbar(subsample, means, yerr=stds)
pyplot.title("XGBoost subsample vs accuracy")
pyplot.xlabel('subsample')
pyplot.ylabel('Accuracy')
pyplot.savefig('subsample.png')
Kết quả chạy:
Fitting 10 folds for each of 9 candidates, totalling 90 fits
[Parallel(n_jobs=-1)]: Using backend LokyBackend with 16 concurrent workers.
[Parallel(n_jobs=-1)]: Done 18 tasks | elapsed: 3.3min
[Parallel(n_jobs=-1)]: Done 90 out of 90 | elapsed: 12.3min finished
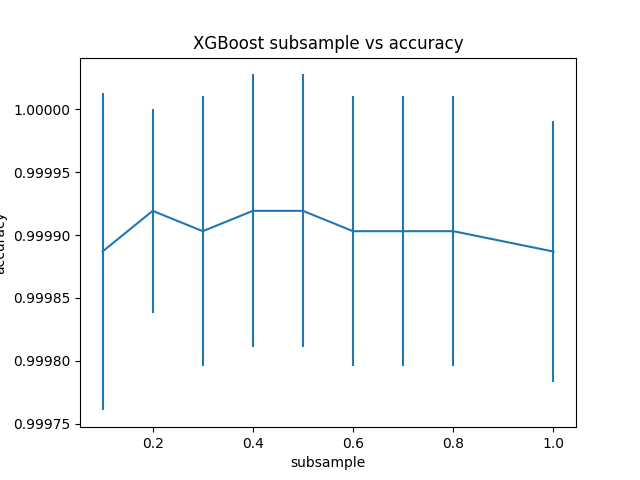
Best: 0.999919 using {'subsample': 0.2}
0.999887 (0.000126) with: {'subsample': 0.1}
0.999919 (0.000081) with: {'subsample': 0.2}
0.999903 (0.000107) with: {'subsample': 0.3}
0.999919 (0.000108) with: {'subsample': 0.4}
0.999919 (0.000108) with: {'subsample': 0.5}
0.999903 (0.000107) with: {'subsample': 0.6}
0.999903 (0.000107) with: {'subsample': 0.7}
0.999903 (0.000107) with: {'subsample': 0.8}
0.999887 (0.000103) with: {'subsample': 1.0}Độ chính xác của model đạt được bằng 0.999919 tại điểm subsample = 0.2, hay subset của mỗi model = 30% train set.
Đồ thị bên dưới thể hiện mối quan hệ giữa subsample và accuracy.
2. Tuning Column Subsampling by Tree
Chúng ta cũng có thể tạo ra một tập ngẫu nhiên các input features để sử dụng cho mỗi decision tree. Trong XGBoost, điều này được cấu hình thông qua tham số colsample_tree. Giá trị mặc định của nó là 1, tức là tất cả các input features đều được sử dụng cho mỗi tree.
Ta sẽ thử tune tham số này với tập giá trị như sau: [0.1, 0.2, 0.3, 0.4, 0.5, 0.6, 0.7, 0.8, 1.0]
Code đầy đủ:
# XGBoost on Otto dataset, tune colsample_bytree
from pandas import read_csv
from xgboost import XGBClassifier
from sklearn.model_selection import GridSearchCV
from sklearn.model_selection import StratifiedKFold
from sklearn.preprocessing import LabelEncoder
import matplotlib
matplotlib.use('Agg')
from matplotlib import pyplot

# load data
data = read_csv('train.csv')
dataset = data.values

# split data into X and y
X = dataset[:,0:94]
y = dataset[:,94]

# encode string class values as integers
label_encoded_y = LabelEncoder().fit_transform(y)

# grid search
model = XGBClassifier()
colsample_bytree = [0.1, 0.2, 0.3, 0.4, 0.5, 0.6, 0.7, 0.8, 1.0]
param_grid = dict(colsample_bytree=colsample_bytree)
kfold = StratifiedKFold(n_splits=10, shuffle=True, random_state=7)
grid_search = GridSearchCV(model, param_grid, scoring="accuracy", n_jobs=-1, cv=kfold, verbose=1)
grid_result = grid_search.fit(X, label_encoded_y)

# summarize results
print("Best: %f using %s" % (grid_result.best_score_, grid_result.best_params_))
means = grid_result.cv_results_['mean_test_score']
stds = grid_result.cv_results_['std_test_score']
params = grid_result.cv_results_['params']
for mean, stdev, param in zip(means, stds, params):
    print("%f (%f) with: %r" % (mean, stdev, param))

# plot
pyplot.errorbar(colsample_bytree, means, yerr=stds)
pyplot.title("XGBoost colsample_bytree vs accuracy")
pyplot.xlabel('colsample_bytree')
pyplot.ylabel('accuracy')
pyplot.savefig('colsample_bytree.png')
Kết quả:
Fitting 10 folds for each of 9 candidates, totalling 90 fits
[Parallel(n_jobs=-1)]: Using backend LokyBackend with 16 concurrent workers.
[Parallel(n_jobs=-1)]: Done 18 tasks | elapsed: 3.0min
[Parallel(n_jobs=-1)]: Done 90 out of 90 | elapsed: 10.6min finished
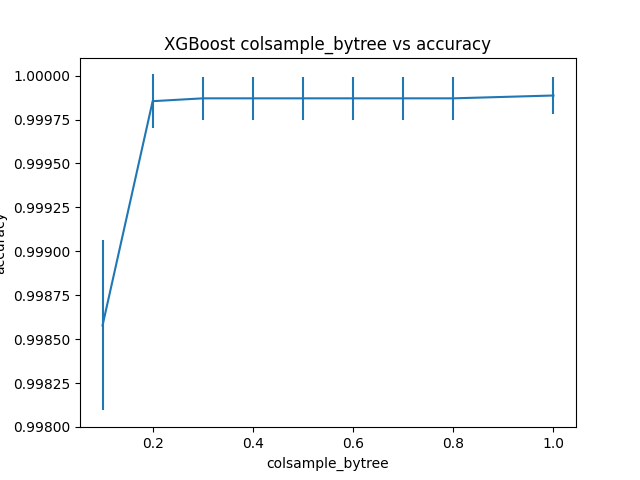
Best: 0.999887 using {'colsample_bytree': 1.0}
0.998578 (0.000484) with: {'colsample_bytree': 0.1}
0.999855 (0.000152) with: {'colsample_bytree': 0.2}
0.999871 (0.000121) with: {'colsample_bytree': 0.3}
0.999871 (0.000121) with: {'colsample_bytree': 0.4}
0.999871 (0.000121) with: {'colsample_bytree': 0.5}
0.999871 (0.000121) with: {'colsample_bytree': 0.6}
0.999871 (0.000121) with: {'colsample_bytree': 0.7}
0.999871 (0.000121) with: {'colsample_bytree': 0.8}
0.999887 (0.000103) with: {'colsample_bytree': 1.0}Độ chính xác của XGBoost đạt được là 0.999887 tại colsample_bytree = 1.0. Điều này có nghĩa rằng trong trường hợp này, subsampling column không mang lại giá trị nào.
Đồ thị thể hiện mối quan hệ giữa subsampling column và accuracy.
3. Tuning Column Subsampling by Split
Thay vì subsampling column cho mỗi tree, ta có thể subsampling column ở mức node (hay Split). Tức là tại mỗi node, ta sẽ subsampling column để tìm ra 1 tập ngẫu nhiên các input features để quyết định hướng đi tiếp theo. Đây chính là điểm khác biệt giữa Random Forest và Bagging meta-data mà ta đã đề cập đến trong bài 2 của chuỗi các bài viết về XGBoost.
Subsampling column ở mức node được cấu hình thông qua tham số colsample_bylevel. Ta sẽ tiến hành tune tham số này với giá trị thay đổi từ 10% đến giá trị mặc định ban đầu của nó (100%).
Code đầy đủ như bên dưới:
# XGBoost on Otto dataset, tune colsample_bylevel
from pandas import read_csv
from xgboost import XGBClassifier
from sklearn.model_selection import GridSearchCV
from sklearn.model_selection import StratifiedKFold
from sklearn.preprocessing import LabelEncoder
import matplotlib
matplotlib.use('Agg')
from matplotlib import pyplot

# load data
data = read_csv('train.csv')
dataset = data.values

# split data into X and y
X = dataset[:,0:94]
y = dataset[:,94]

# encode string class values as integers
label_encoded_y = LabelEncoder().fit_transform(y)

# grid search
model = XGBClassifier()
colsample_bylevel = [0.1, 0.2, 0.3, 0.4, 0.5, 0.6, 0.7, 0.8, 1.0]
param_grid = dict(colsample_bylevel=colsample_bylevel)
kfold = StratifiedKFold(n_splits=10, shuffle=True, random_state=7)
grid_search = GridSearchCV(model, param_grid, scoring="accuracy", n_jobs=-1, cv=kfold, verbose=1)
grid_result = grid_search.fit(X, label_encoded_y)

# summarize results
print("Best: %f using %s" % (grid_result.best_score_, grid_result.best_params_))
means = grid_result.cv_results_['mean_test_score']
stds = grid_result.cv_results_['std_test_score']
params = grid_result.cv_results_['params']
for mean, stdev, param in zip(means, stds, params):
    print("%f (%f) with: %r" % (mean, stdev, param))

# plot
pyplot.errorbar(colsample_bylevel, means, yerr=stds)
pyplot.title("XGBoost colsample_bylevel vs accuracy")
pyplot.xlabel('colsample_bylevel')
pyplot.ylabel('accuracy')
pyplot.savefig('colsample_bylevel.png')
Kết quả:
Fitting 10 folds for each of 9 candidates, totalling 90 fits
[Parallel(n_jobs=-1)]: Using backend LokyBackend with 16 concurrent workers.
[Parallel(n_jobs=-1)]: Done 18 tasks | elapsed: 2.6min
[Parallel(n_jobs=-1)]: Done 90 out of 90 | elapsed: 9.3min finished
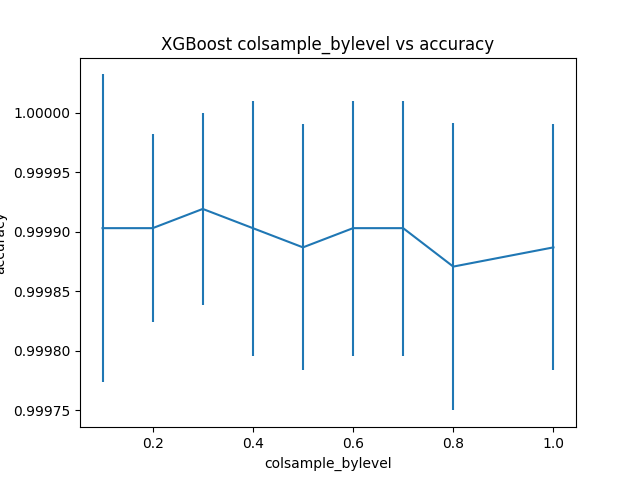
Best: 0.999919 using {'colsample_bylevel': 0.3}
0.999903 (0.000129) with: {'colsample_bylevel': 0.1}
0.999903 (0.000079) with: {'colsample_bylevel': 0.2}
0.999919 (0.000081) with: {'colsample_bylevel': 0.3}
0.999903 (0.000107) with: {'colsample_bylevel': 0.4}
0.999887 (0.000103) with: {'colsample_bylevel': 0.5}
0.999903 (0.000107) with: {'colsample_bylevel': 0.6}
0.999903 (0.000107) with: {'colsample_bylevel': 0.7}
0.999871 (0.000121) with: {'colsample_bylevel': 0.8}
0.999887 (0.000103) with: {'colsample_bylevel': 1.0}colsample_bylevel = 0.3 cho ta model với độ chính xác cao nhất, 0.999919.
Đồ thị thể hiện mối quan hệ giữa colsample_bylevel và accuracy.
6. Kết luận
Như vậy là chúng ta đã biêt cách tuning các kỹ thuật subsample hay stochastic gradient boosting của XGBoost. Nếu có phần cứng đủ mạnh, các bạn có thể tune tất cả các tham số đồng thời với nhau. Khi đó, độ chính xác của model có thể tăng lên 1 chút. Nhưng cái giá phải trả là thời gian train sẽ rất lâu. 😀
Đây cũng là bài cuối cùng trong loạt bài viết về XGBoost model. Hi vọng qua những bài viết của mình, các bạn có thể hiểu hơn về XGBoost và tự tin hơn khi làm viêc với nó. Hẹn mọi người ở những chủ để tiếp theo! 🙂
Toàn bộ source code của bài này các bạn có thể tham khảo trên github cá nhân của mình tại github.
Tham khảo bài viết gốc tại đây.


Vui lòng đăng nhập để bình luận.